LASER SCANNING
Laser scanning is a modern technology for collecting spatial data in the form of coordinates of points in space. Information about the shape and eventual appearance of objects from the real world is collected. The collected data can then be used to construct digital, two-dimensional drawings or three-dimensional models with a wide range of applications. The advantage of laser scanning in comparison to other spatial data acquisition technologies is the fact that this way a large number of points can be recorded, with high accuracy, for a relatively short time.
Equipment
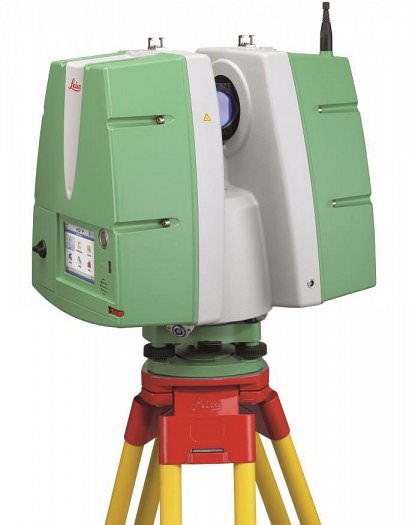
The Geoinformatics Laboratory has a Leica ScanStation P20 terrestrial laser scanner, which is used for teaching, preparing thesis and scientific research. The table shows the basic characteristics of the device.
- Name: Leica ScanStation P20
- Resolution: maximum 0.8 mm at 10 m, the lowest 50 mm -10 m
- Range: min. 0.4m, max 120m
- Speed: up to one million dots per second
- Field of view: 360 horizontal, 270 vertical
- Accuracy of coordinates: 3mm at 50m, 6mm at 100m
- Corner accuracy: 8 “horizontal, 8” vertical
- The diameter of the air at the exit : <= 2.8mm
- Air divergence: 0.2mrad
- Camera: 5 megapixels
Software
The processing of data obtained by laser scanning uses the leading open source and commercial software tools. Geoinformatic Laboratory has academic licenses contracts with Leica, TerraSolid, and Hexagon.
Galery
Campus of the University of Novi Sad
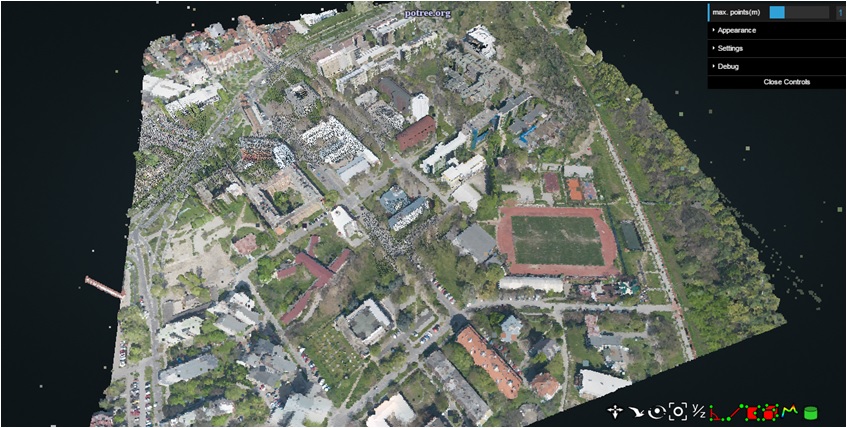
LiDAR recording of the entire area of the campus of the University of Novi Sad was done in April 2017. As a result of the recording, a detailed cloud point (40 points per square meter) and an orthophoto plan (20cm) were obtained. The detailed 3D model of the campus is currently being developed, which will be published on this site in CityGML format. Cloud cover is published through the Potree web viewer and you can view it by clicking on the link.
Center of Novi Sad
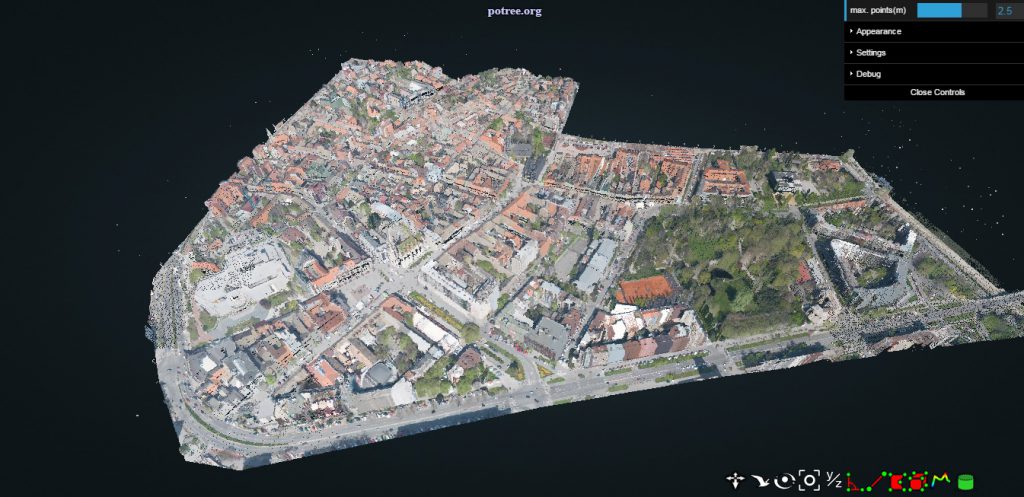
The center of Novi Sad was recorded the same day as the University campus. This cloud spot is also published through the Potree web viewer and can be viewed by clicking on the link.
The Petrovaradin Fortress
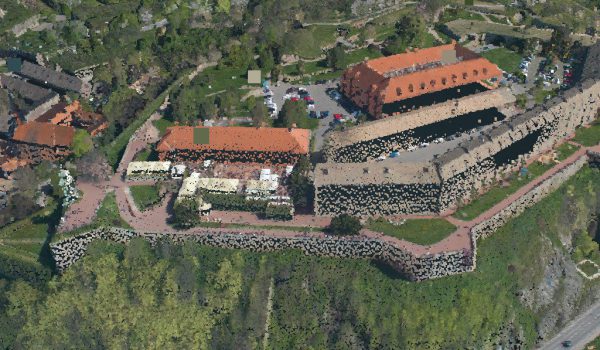
Within the same campaign, the area of the Petrovaradin Fortress was also recorded. You can view the data by clicking on the link.
Petrovaradin – suburb
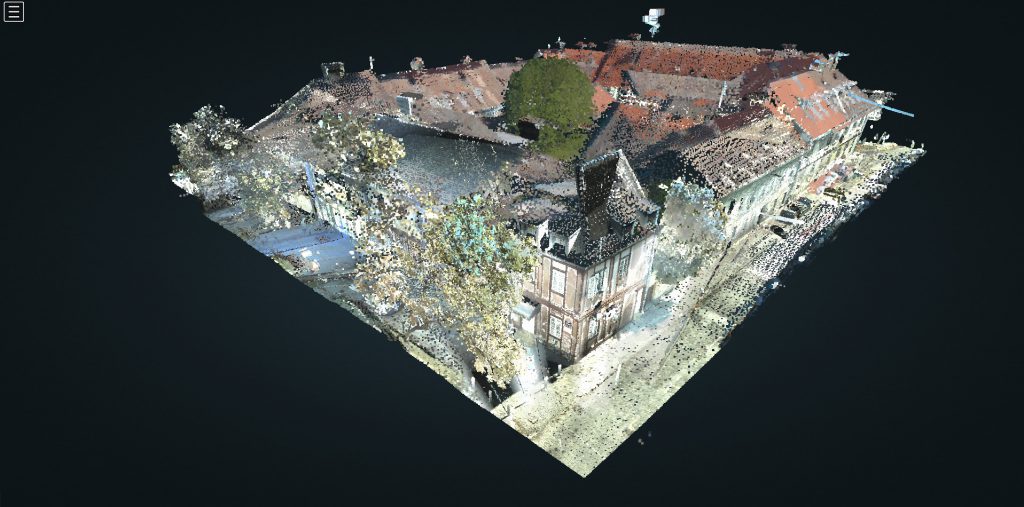
In addition to the data obtained by shooting from the air, the part of Petrovaradin beneath the fortress (suburb) was also recorded terrestrial. Two sets of data are merged as a whole, and you can see part of the results by clicking on the link.
Powerlines
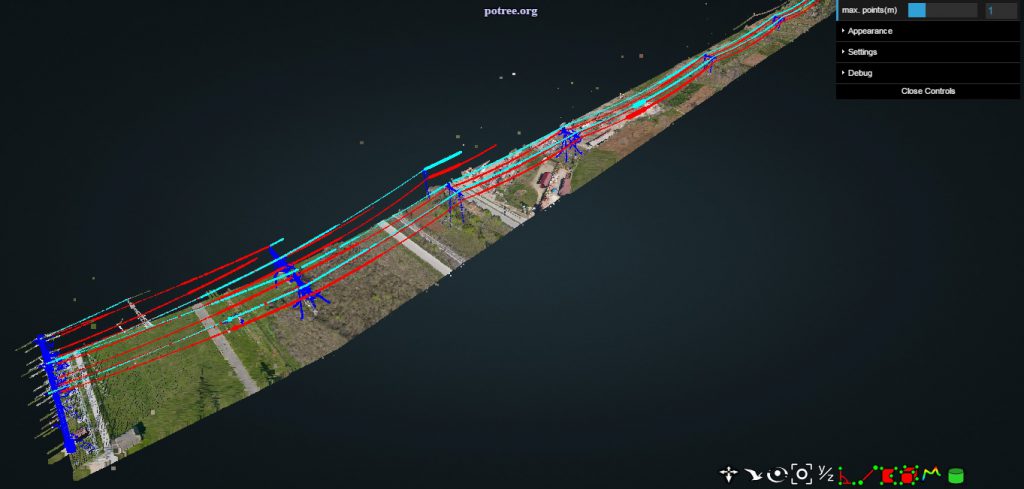
Within the geoinformatics laboratory, processing of transmission lines was performed which included high voltage lines of 110kV, 220kV and 400kV. Part of the data is published by Potree web viewer and you can view it by clicking on the link.
Projects
Aerial Laser Scanning
Geoinformatics Laboratory deals wth numerous data processing projects obtained by laser scanning. LiDAR system is mostly used. Our experts participate in all phases of the project of recording from the preparation of recording, preliminary data processing, calibration, classification, production of products for delivery, visualization and data publications.
Powerlines
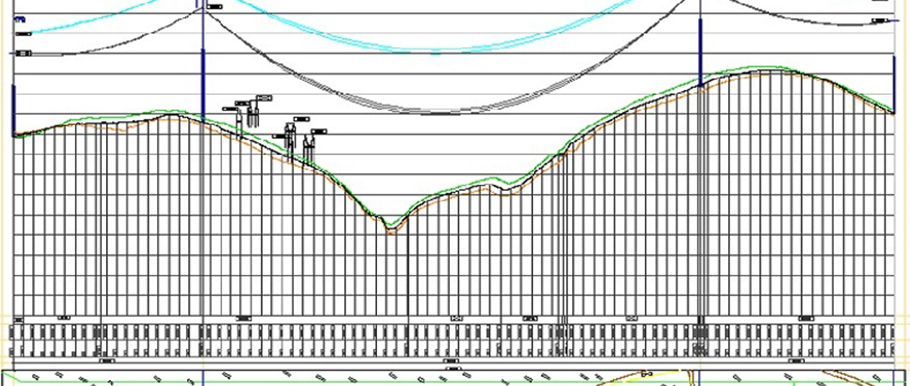
The projects included recording high voltage lines of 110kV, 220kV and 400kV. The recording system used an integrated system consisting of a Riegl LMS-Q680i laser scanner, two digital cameras DigiCAM H39 (overhead and sloping), DigiTHERM thermal cameras and a GPS-IMU system. In view of this, data collected in the form of dots, digital vertical and slice images, thermal images and flight trajectories were collected. After processing the data, obtained data were calibrated and classified cloud points, digital orthophoto, 3D models of transmission lines (towers and lines) and adjacent objects, longitudinal profiles of the transmission line with marked relevant data, georeferenced vertical and slit images, georeferenced thermal video.

