Spatial Data Visualization
Spatial data visualization started its development with standard maps. Maps have been used to visualize spatial data, or to be more exact, the data that are related to locations or attributes of objects and phenomena located on Earth. maps provide users with better understanding of spatial relationships. Maps can be used to collect information about distances, orientations, areas, detect certain patterns and quantify and understand relations between spatial objects.
Information technologies, GIS and spatial database technologies advancement offered the transition between standard static 2D spatial data visualization and dynamic 2D, 2.5D and recently 3D maps that offer vast amount of data and functionality.
Most recent technology discovery in the area of spatial data visualization is virtual and augmented reality that allow users the experience of spatial data visualization like never before. Visualization and interaction with 3D City models, indoor space models, monuments and other cultural heritage objects are only several possible applications of these technologies.

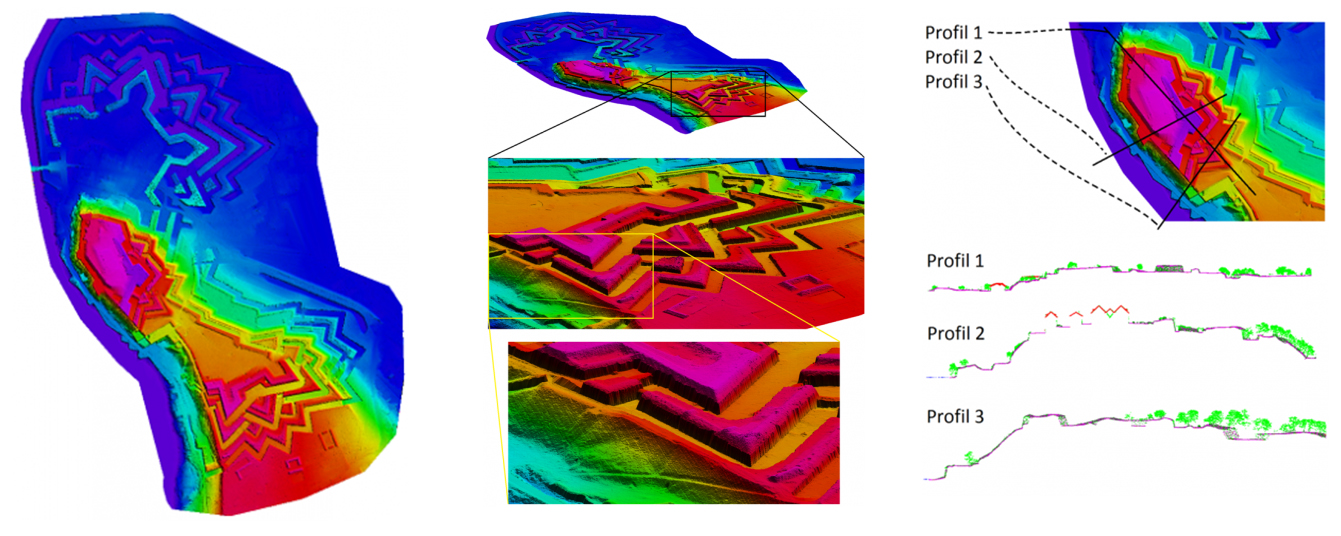
Digital Terrain model for the area of Petrovaradin fortress developed based on aerial LiDAR data. This model provides the information about elevation, lateral and longitudinal profiles and many other information.
Digitalni model terena za područje Petrovaradinske tvrđave izrađen na osnovu podataka dobijenih LiDAR skeniranjem iz vazduha. Iz ovakvog modela mogu se dobiti informacije o visinama, podužni i poprečni profili terena i mnoge druge informacije.

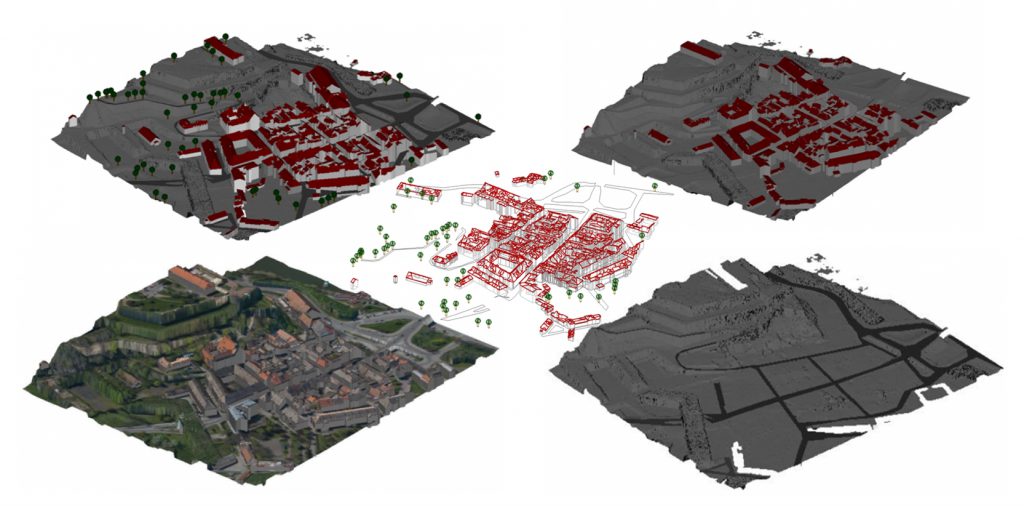
Based on the same data source (LiDAR), 3D models of city below the fortress were developed. Model can be portrayed in many ways, vector or fully photo realistic are just some of them.
Na osnovu istih izvornih podataka (LiDAR), izrađeni su i 3D modeli podgrađa tvrđave prema OGC CityGML standardu. Model može biti prikazan na različite načine, od vektorskog do potpuno fotorealističnog modela.

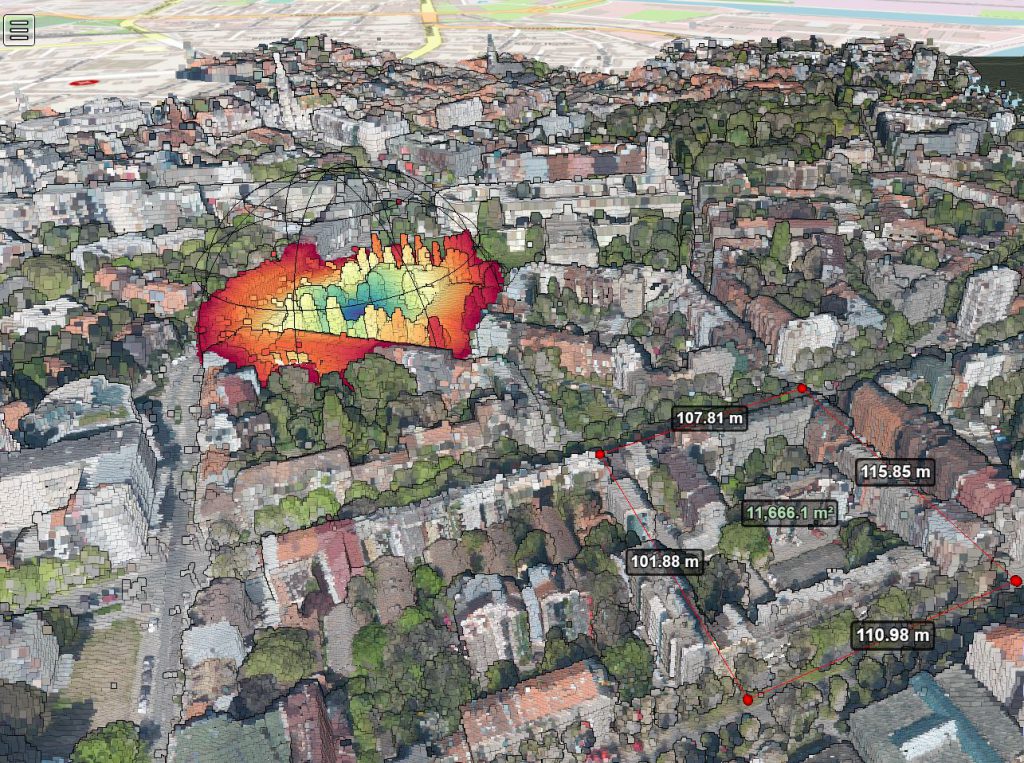
3D visualization of LiDAR data can be done trough Point Cloud Web Viewer Potree. This application offers functionalities such as distance, angle or volume measurements, portrayal optimization and many others.

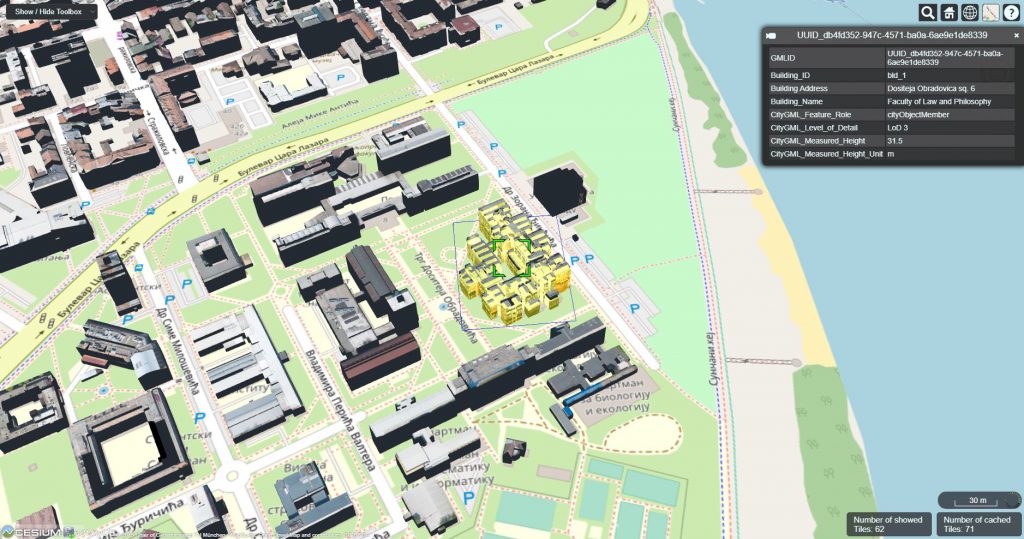
3D city model based on CityGML standard is published trough Web application Web Map Client. Besides geometry of the data, it is possible to add all important attributes such as object height, name, adress, type…

WebVR technology provides the possibilities of 3D model publishing trough virtual reality framework. Models of indoor space of Faculty of Technical Sciences and Petrovaradin Fortress were published using this framework. Both of these models are available in the Projects part of this website.
Photorealistic model of Faculty of Technical Sciences in Novi Sad, published in glTF format trough WebVR framework A-Frame.