Geoinformatics
Geoinformatics has been described as the science and technology dealing with the structure and character of spatial information, its capture, its classification and qualification, its storage, processing, portrayal and dissemination, including the infrastructure necessary to secure optimal use of this information.
Geomatics is a similarly used term which encompasses geoinformatics, but geomatics focuses more so on surveying. Geoinformatics has at its core the technologies supporting the processes of acquiring, analyzing and visualizing spatial data. Both geomatics and geoinformatics include and rely heavily upon the theory and practical implications of geodesy.
Geoinformatics combines geospatial analysis and modeling, development of geospatial databases, information systems design, human-computer interaction and both wired and wireless networking technologies. Geoinformatics uses geocomputation and geovisualization for analyzing geoinformation.
The Open Geospatial Consortium (OGC) is an international consortium of more than 530 businesses, government agencies, research organizations, and universities driven to make geospatial (location) information and services FAIR – Findable, Accessible, Interoperable, and Reusable.
ISO/TC 211 is a standard technical committee formed within ISO, tasked with covering the areas of digital geographic information (such as used by geographic information systems) and geomatics. It is responsible for preparation of a series of International Standards and Technical Specifications numbered in the number range starting at ISO-19101.

Considering data structure, spatial information can be realized trough two types of data model: raster and vector model.
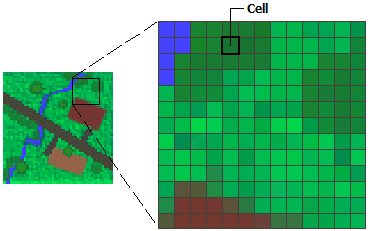
In its simplest form, a raster consists of a matrix of cells (or pixels) organized into rows and columns (or a grid) where each cell contains a value representing information, such as temperature. Rasters are digital aerial photographs, imagery from satellites, digital pictures, or even scanned maps.

Data stored in a raster format represents real-world phenomena:
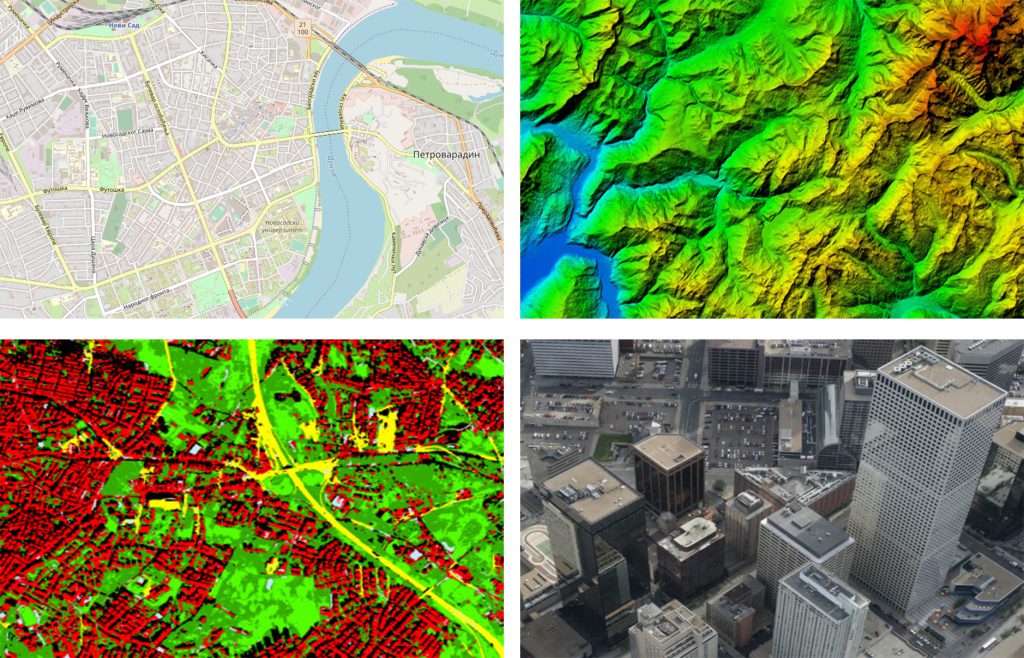
- Thematic data (also known as discrete) represents features such as land-use or soils data.
- Continuous data represents phenomena such as temperature, elevation, or spectral data such as satellite images and aerial photographs.
- Pictures include scanned maps or drawings and building photographs.
Four most common applications of raster model are: base map, digital elevation model, thematic map, photography.

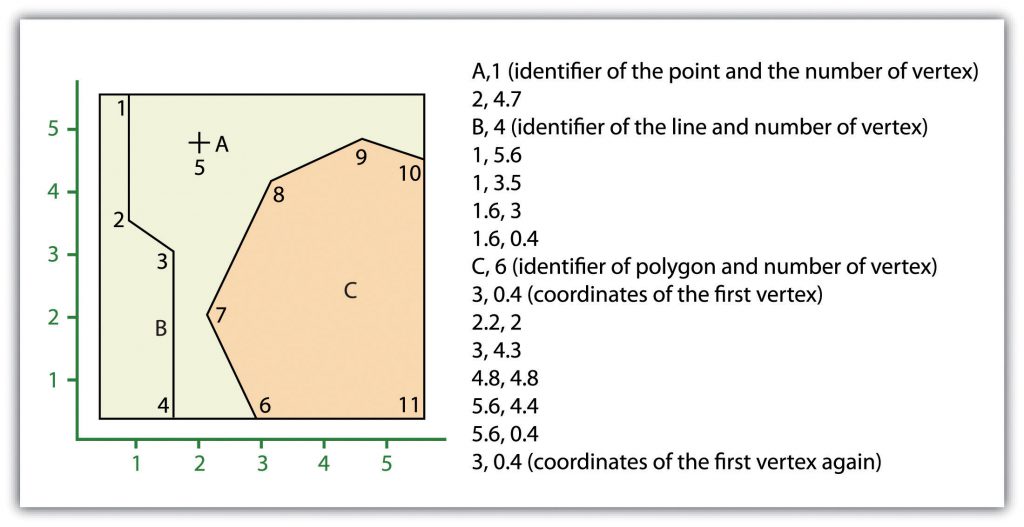
In contrast to the raster data model is the vector data model. In this model, space is not quantized into discrete grid cells like the raster model. Vector data models use points and their associated X, Y coordinate pairs to represent the vertices of spatial features. The data attributes of these features are then stored in a separate database management system. The spatial information and the attribute information for these models are linked via a simple identification number that is given to each feature in a map.
Three fundamental vector types exist in geographic information systems (GISs): points, lines, and polygons. Points are zero-dimensional objects that contain only a single coordinate pair. Points are typically used to model singular, discrete features such as buildings, wells, power poles, sample locations, and so forth. Points have only the property of location. Other types of point features include the node and the vertex. Specifically, a point is a stand-alone feature, while a node is a topological junction representing a common X, Y coordinate pair between intersecting lines and/or polygons. Vertices are defined as each bend along a line or polygon feature that is not the intersection of lines or polygons. Lines are one-dimensional features composed of multiple, explicitly connected points. Lines are used to represent linear features such as roads, streams, faults, boundaries, and so forth. Lines have the property of length. Lines that directly connect two nodes are sometimes referred to as chains, edges, segments, or arcs. Polygons are two-dimensional features created by multiple lines that loop back to create a “closed” feature. In the case of polygons, the first coordinate pair (point) on the first line segment is the same as the last coordinate pair on the last line segment. Polygons are used to represent features such as city boundaries, geologic formations, lakes, soil associations, vegetation communities, and so forth. Polygons have the properties of area and perimeter.
